
Data Aggregator
2018
Stakeholder Collaboration / Interface Design
In Essense:
An internal marketing platform for them to stay updated to the latest trends that revolves around a selected brand.
Designing for our own
Internal projects are often the trickiest, paired with high expectations, with the fact that it is my first project in Isobar. Working together with direct stakeholders were a blessing as they are very clear on what they wanted, with flexibility and acceptance into the UX practice.
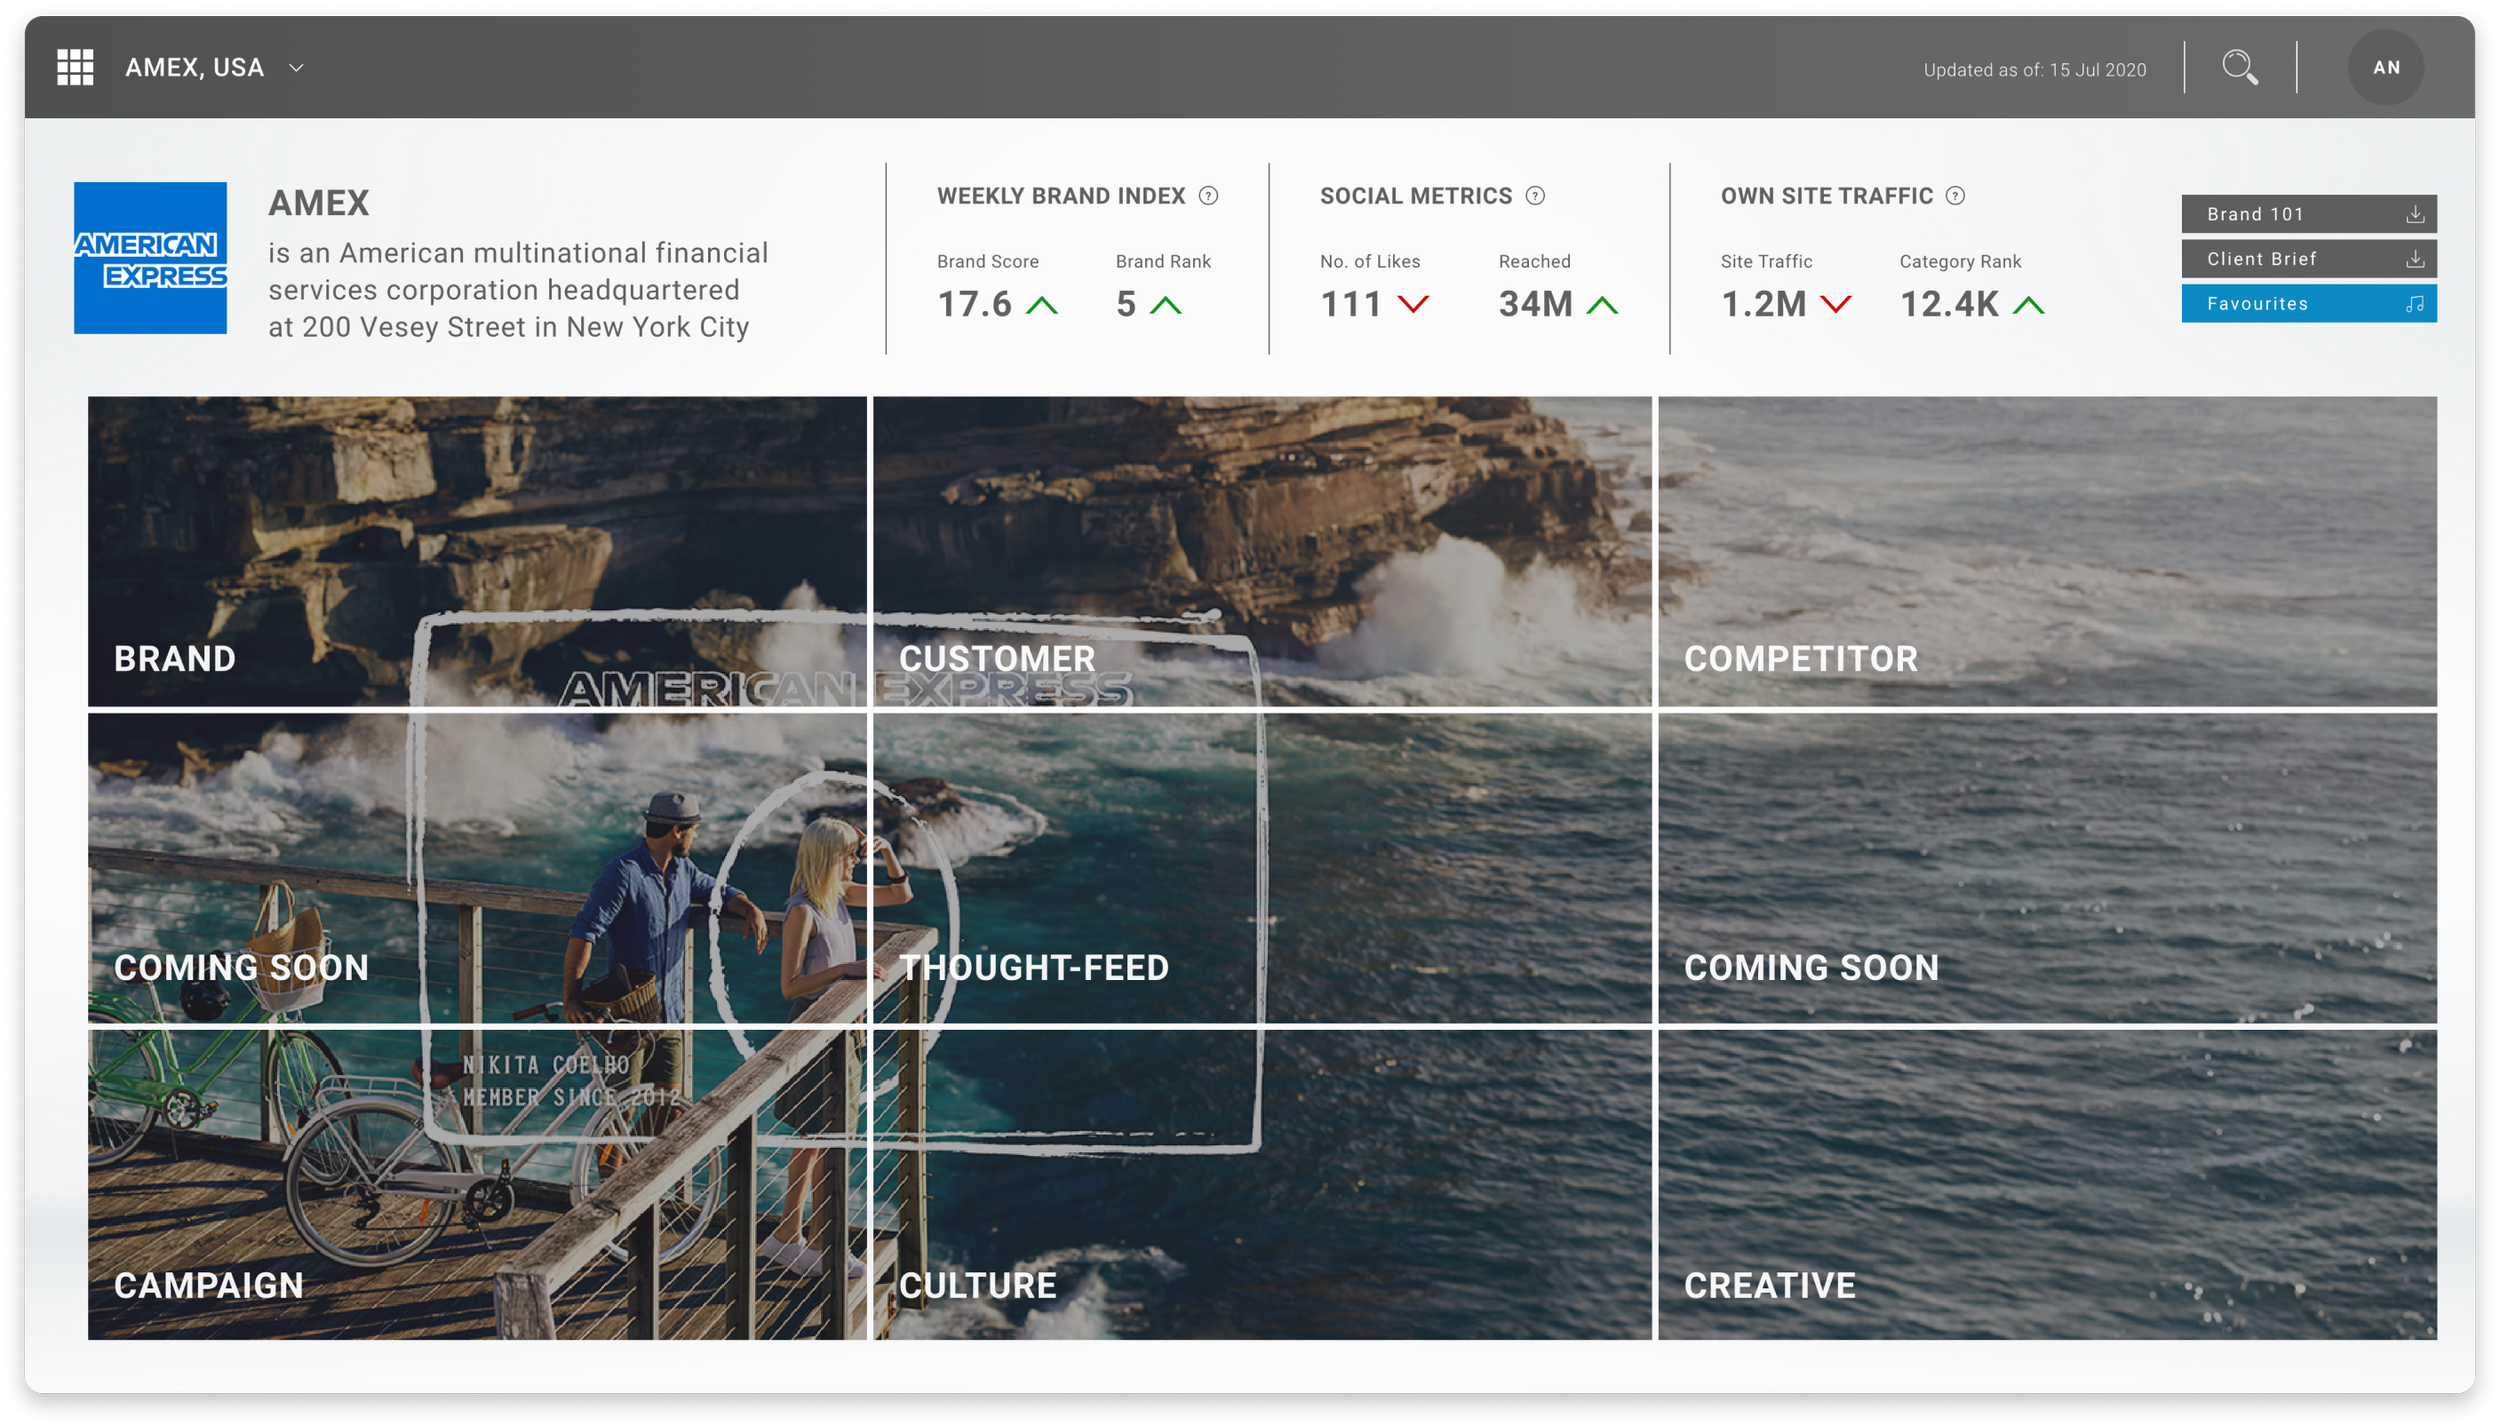
Key Screens
Brand Pesence
Brand Pesence
First main part of the platform was to allow marketers to be able to quickly gather data points from the brand. Adjust based on what they require and also be used into their presentations when needed.
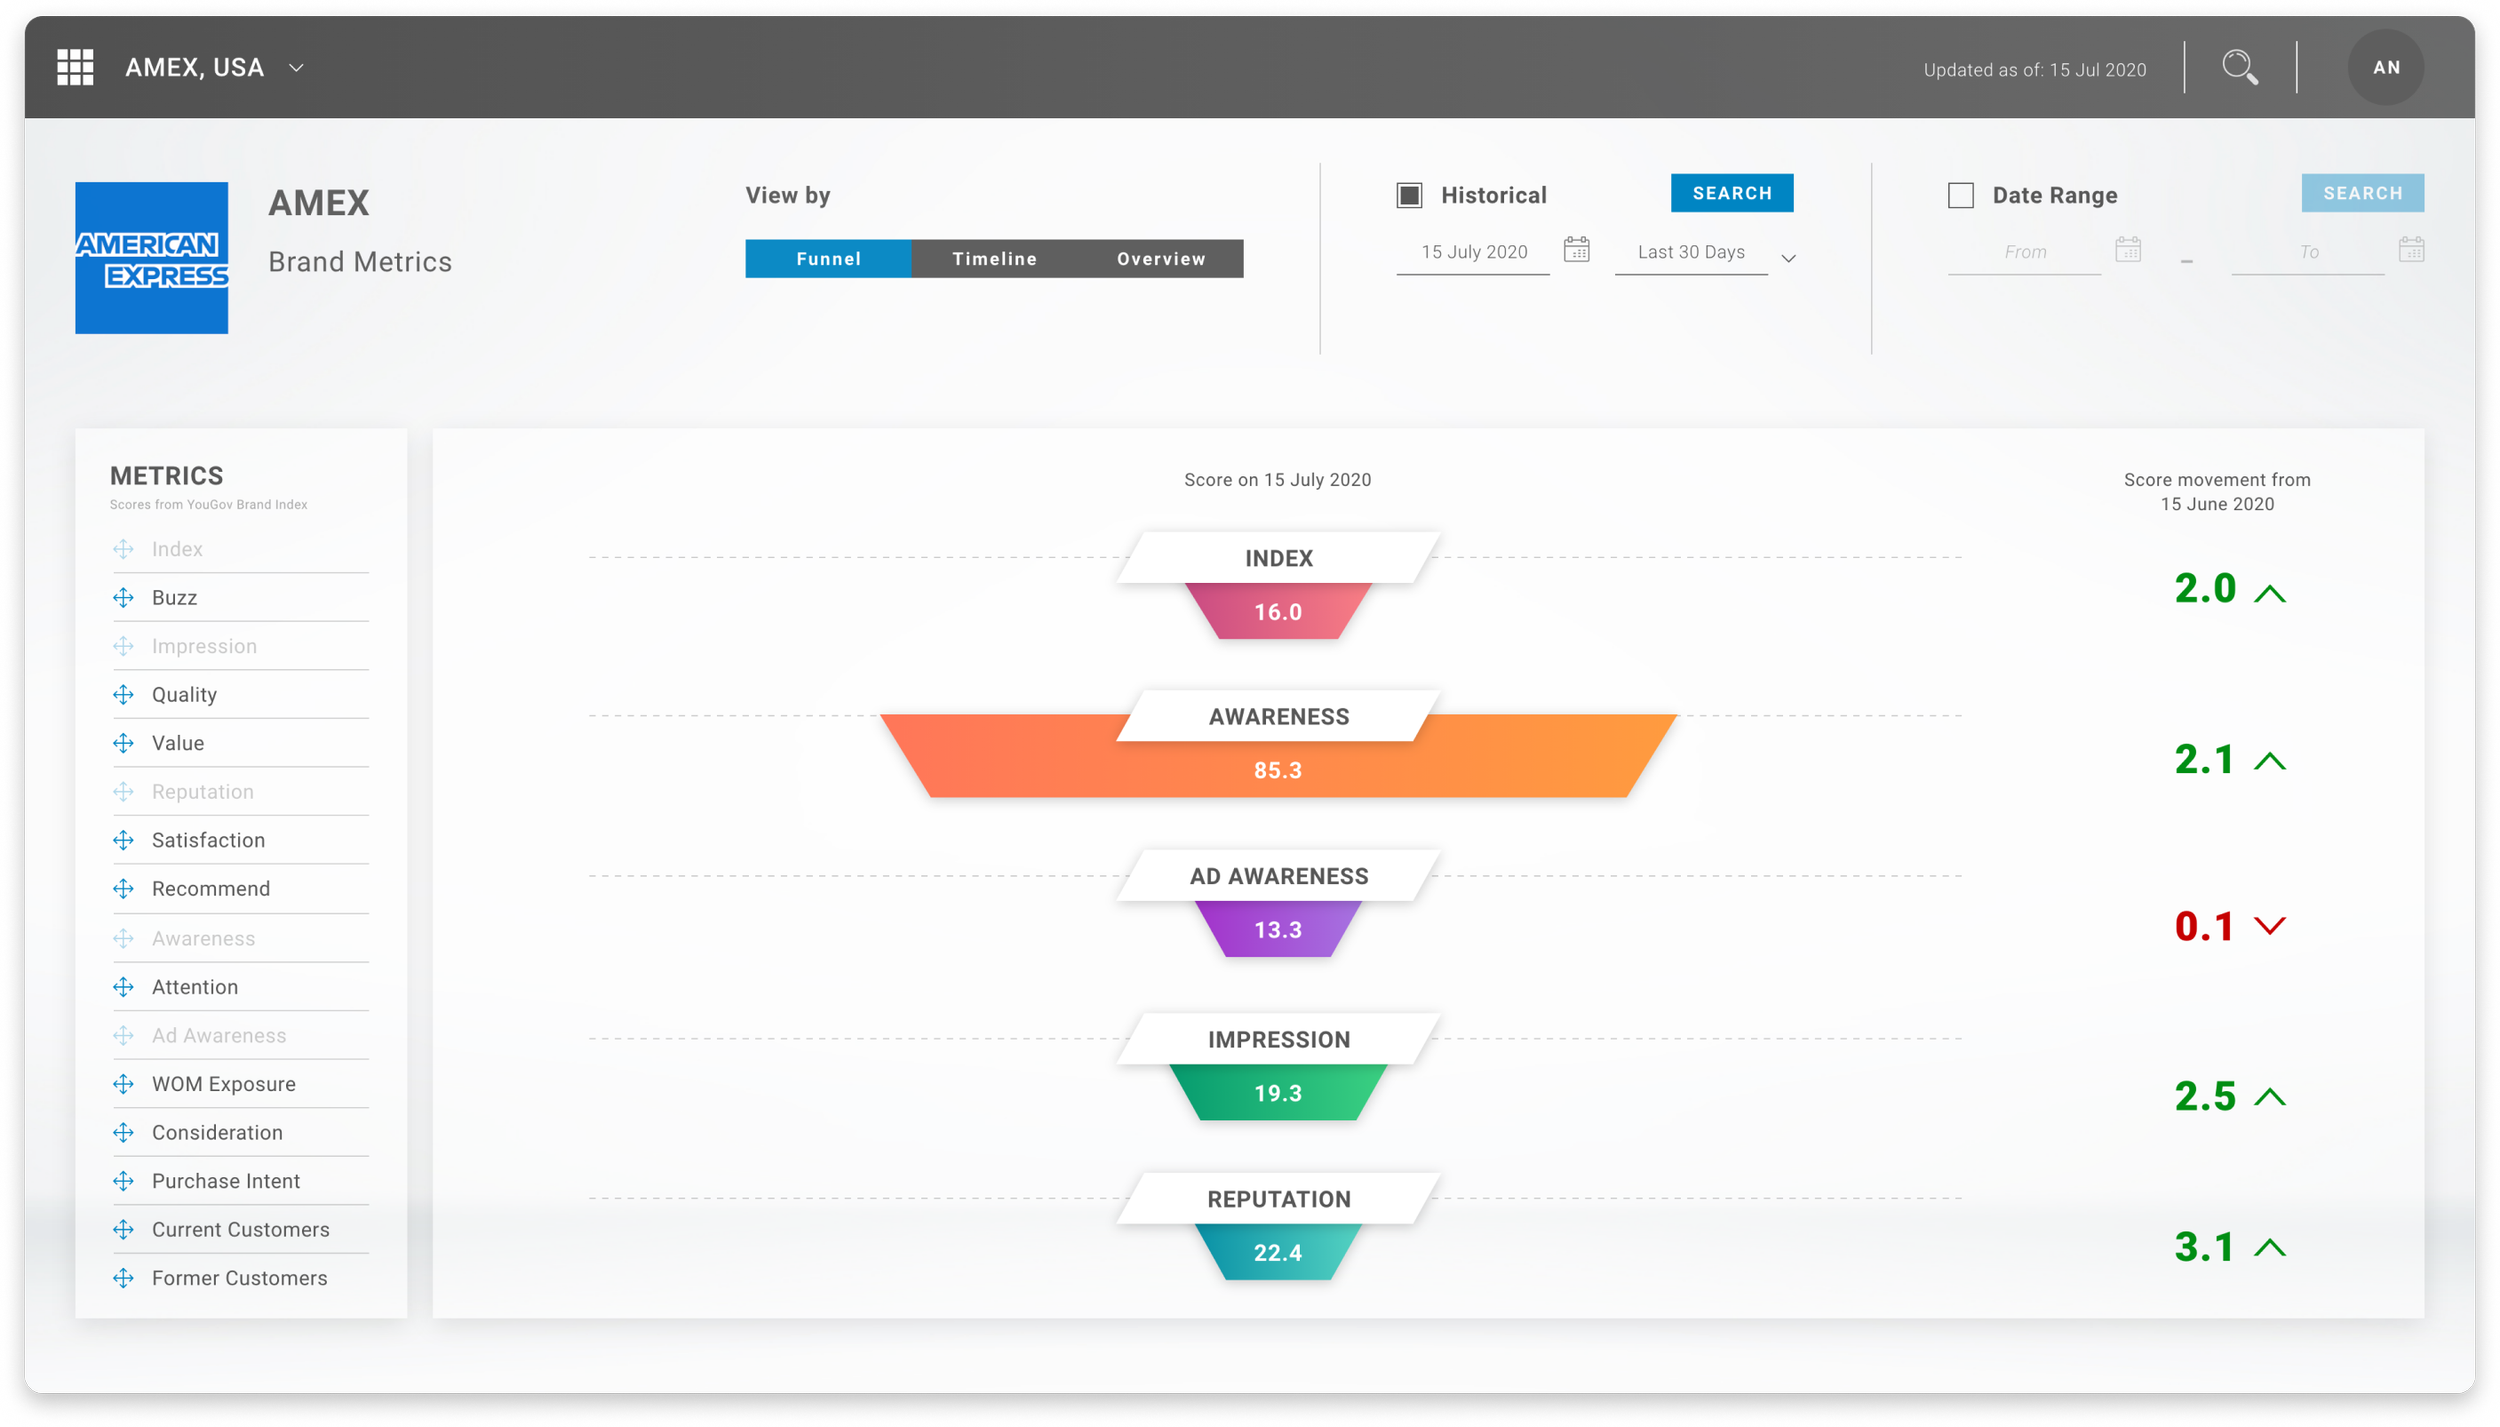
Taking the conventional funnel tool, it is used to visualise data gathered and displayed for quick understanding the performance based on selected period.
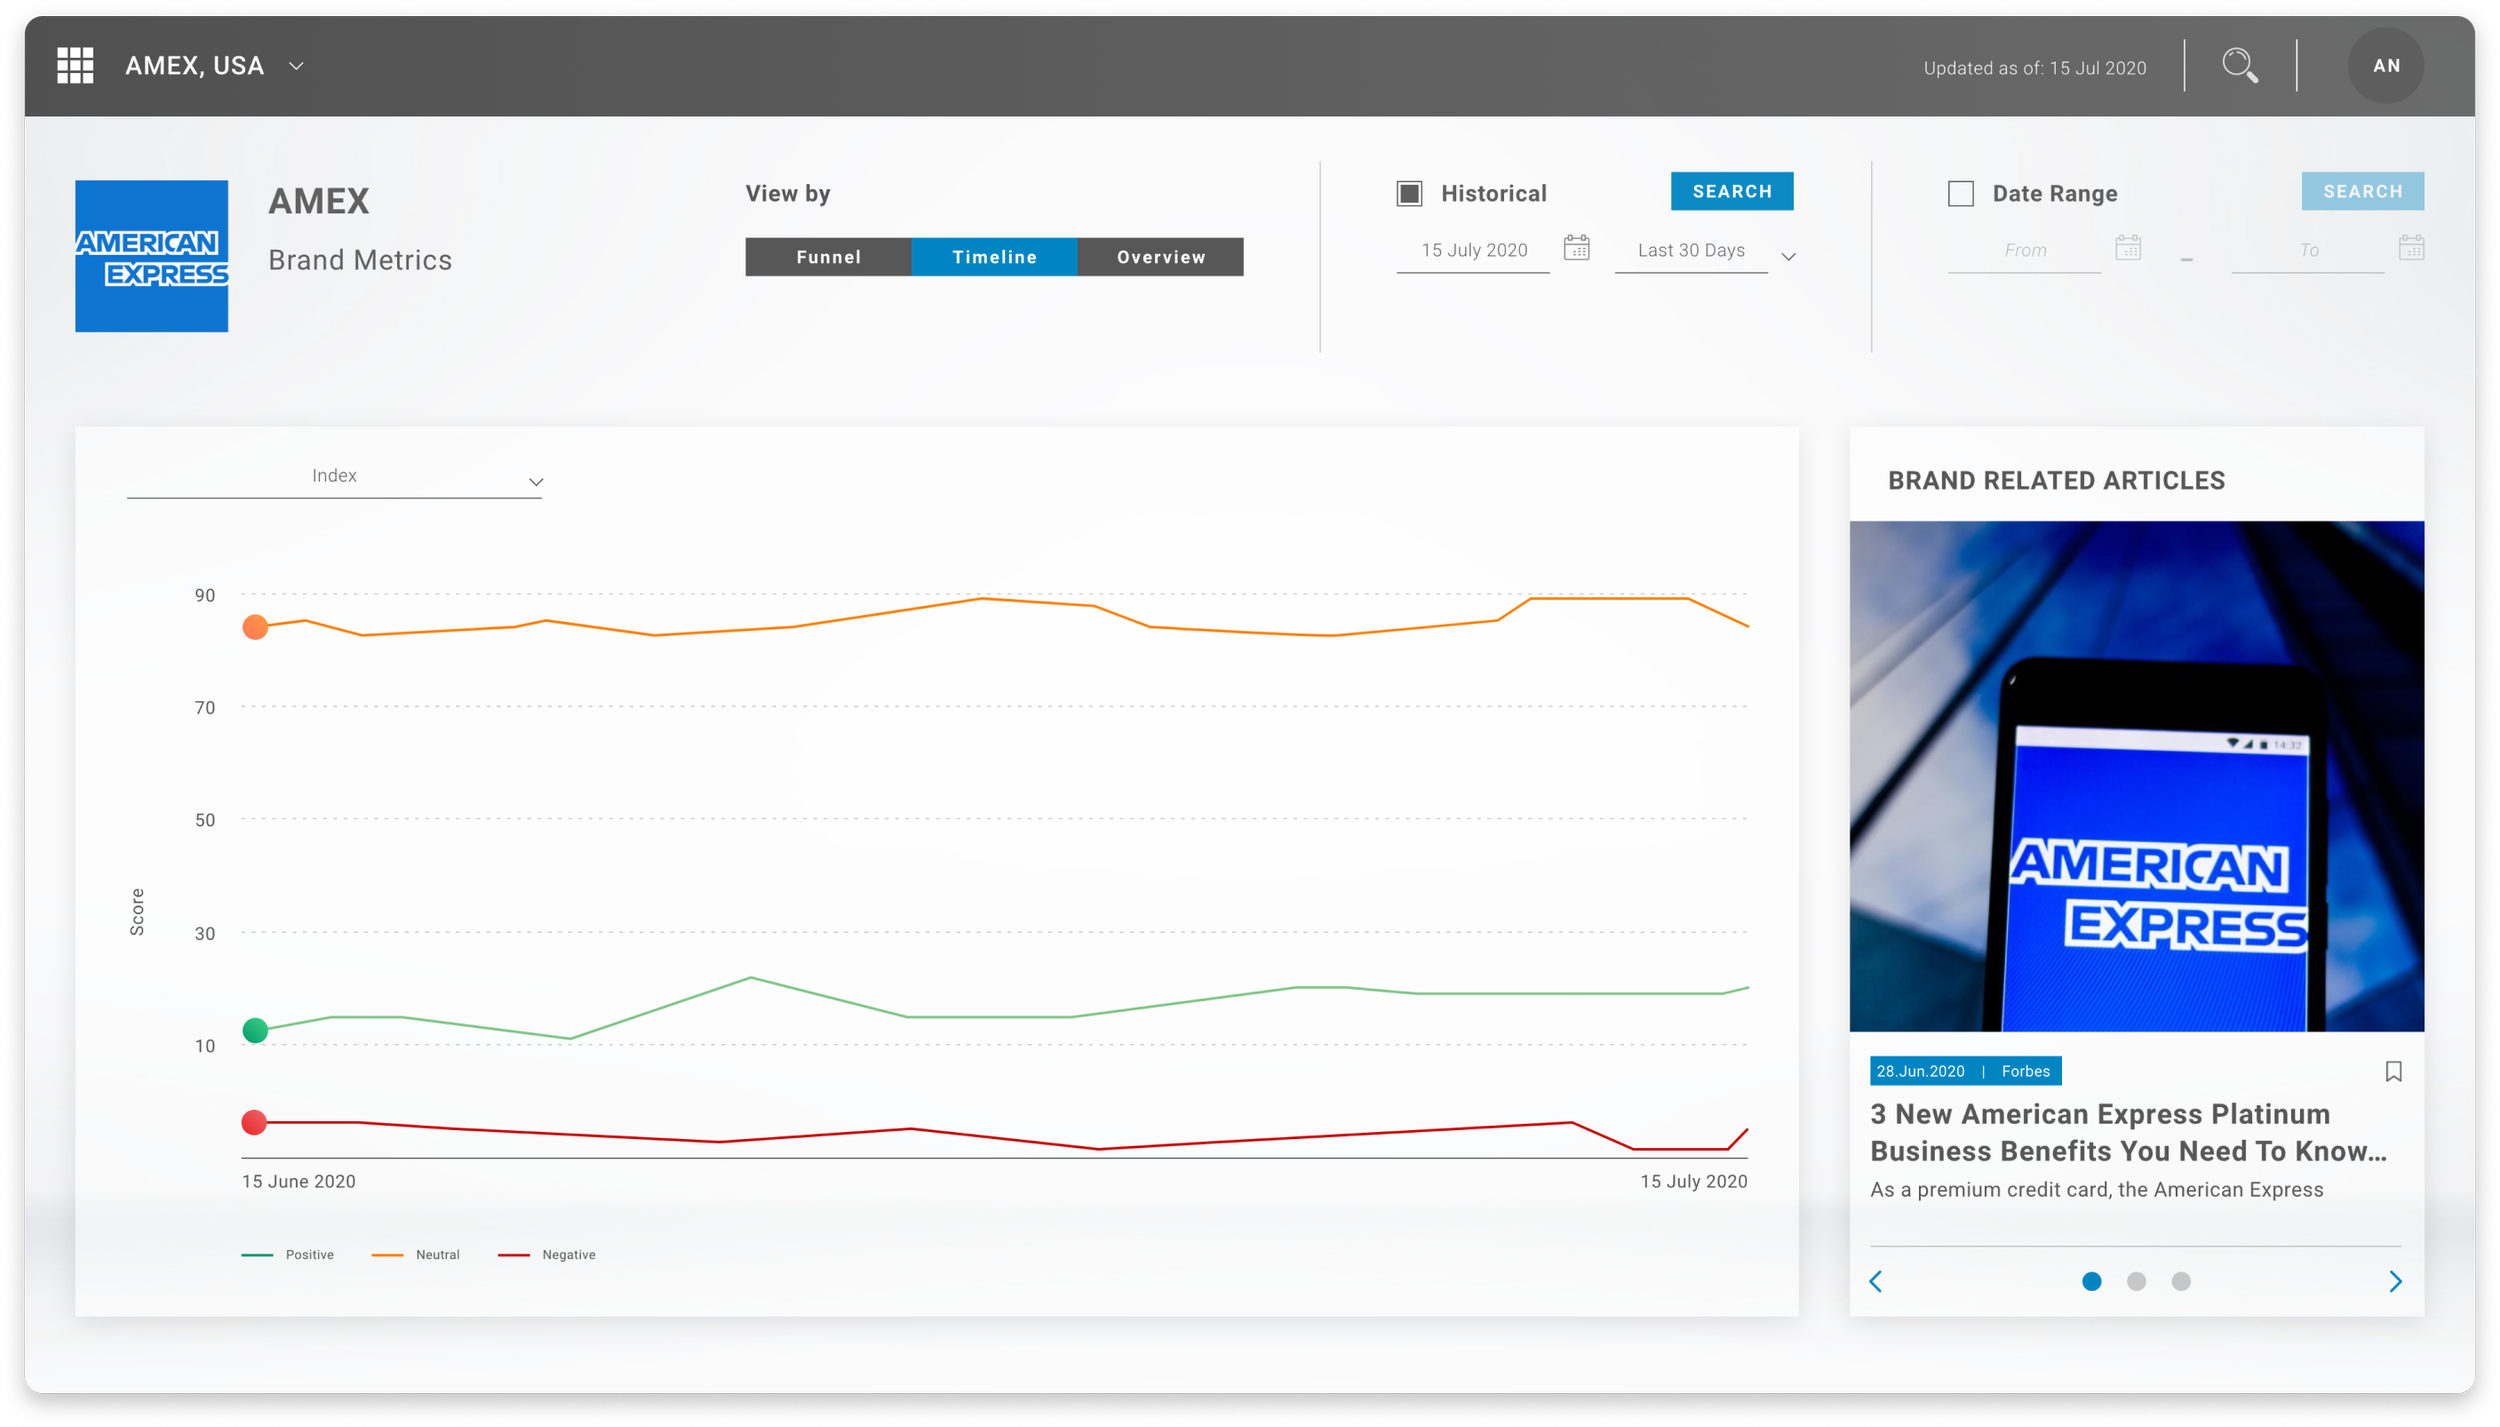
A timeline view for better growth display over a period of time, with related articles that inform the ups and downs during that time.
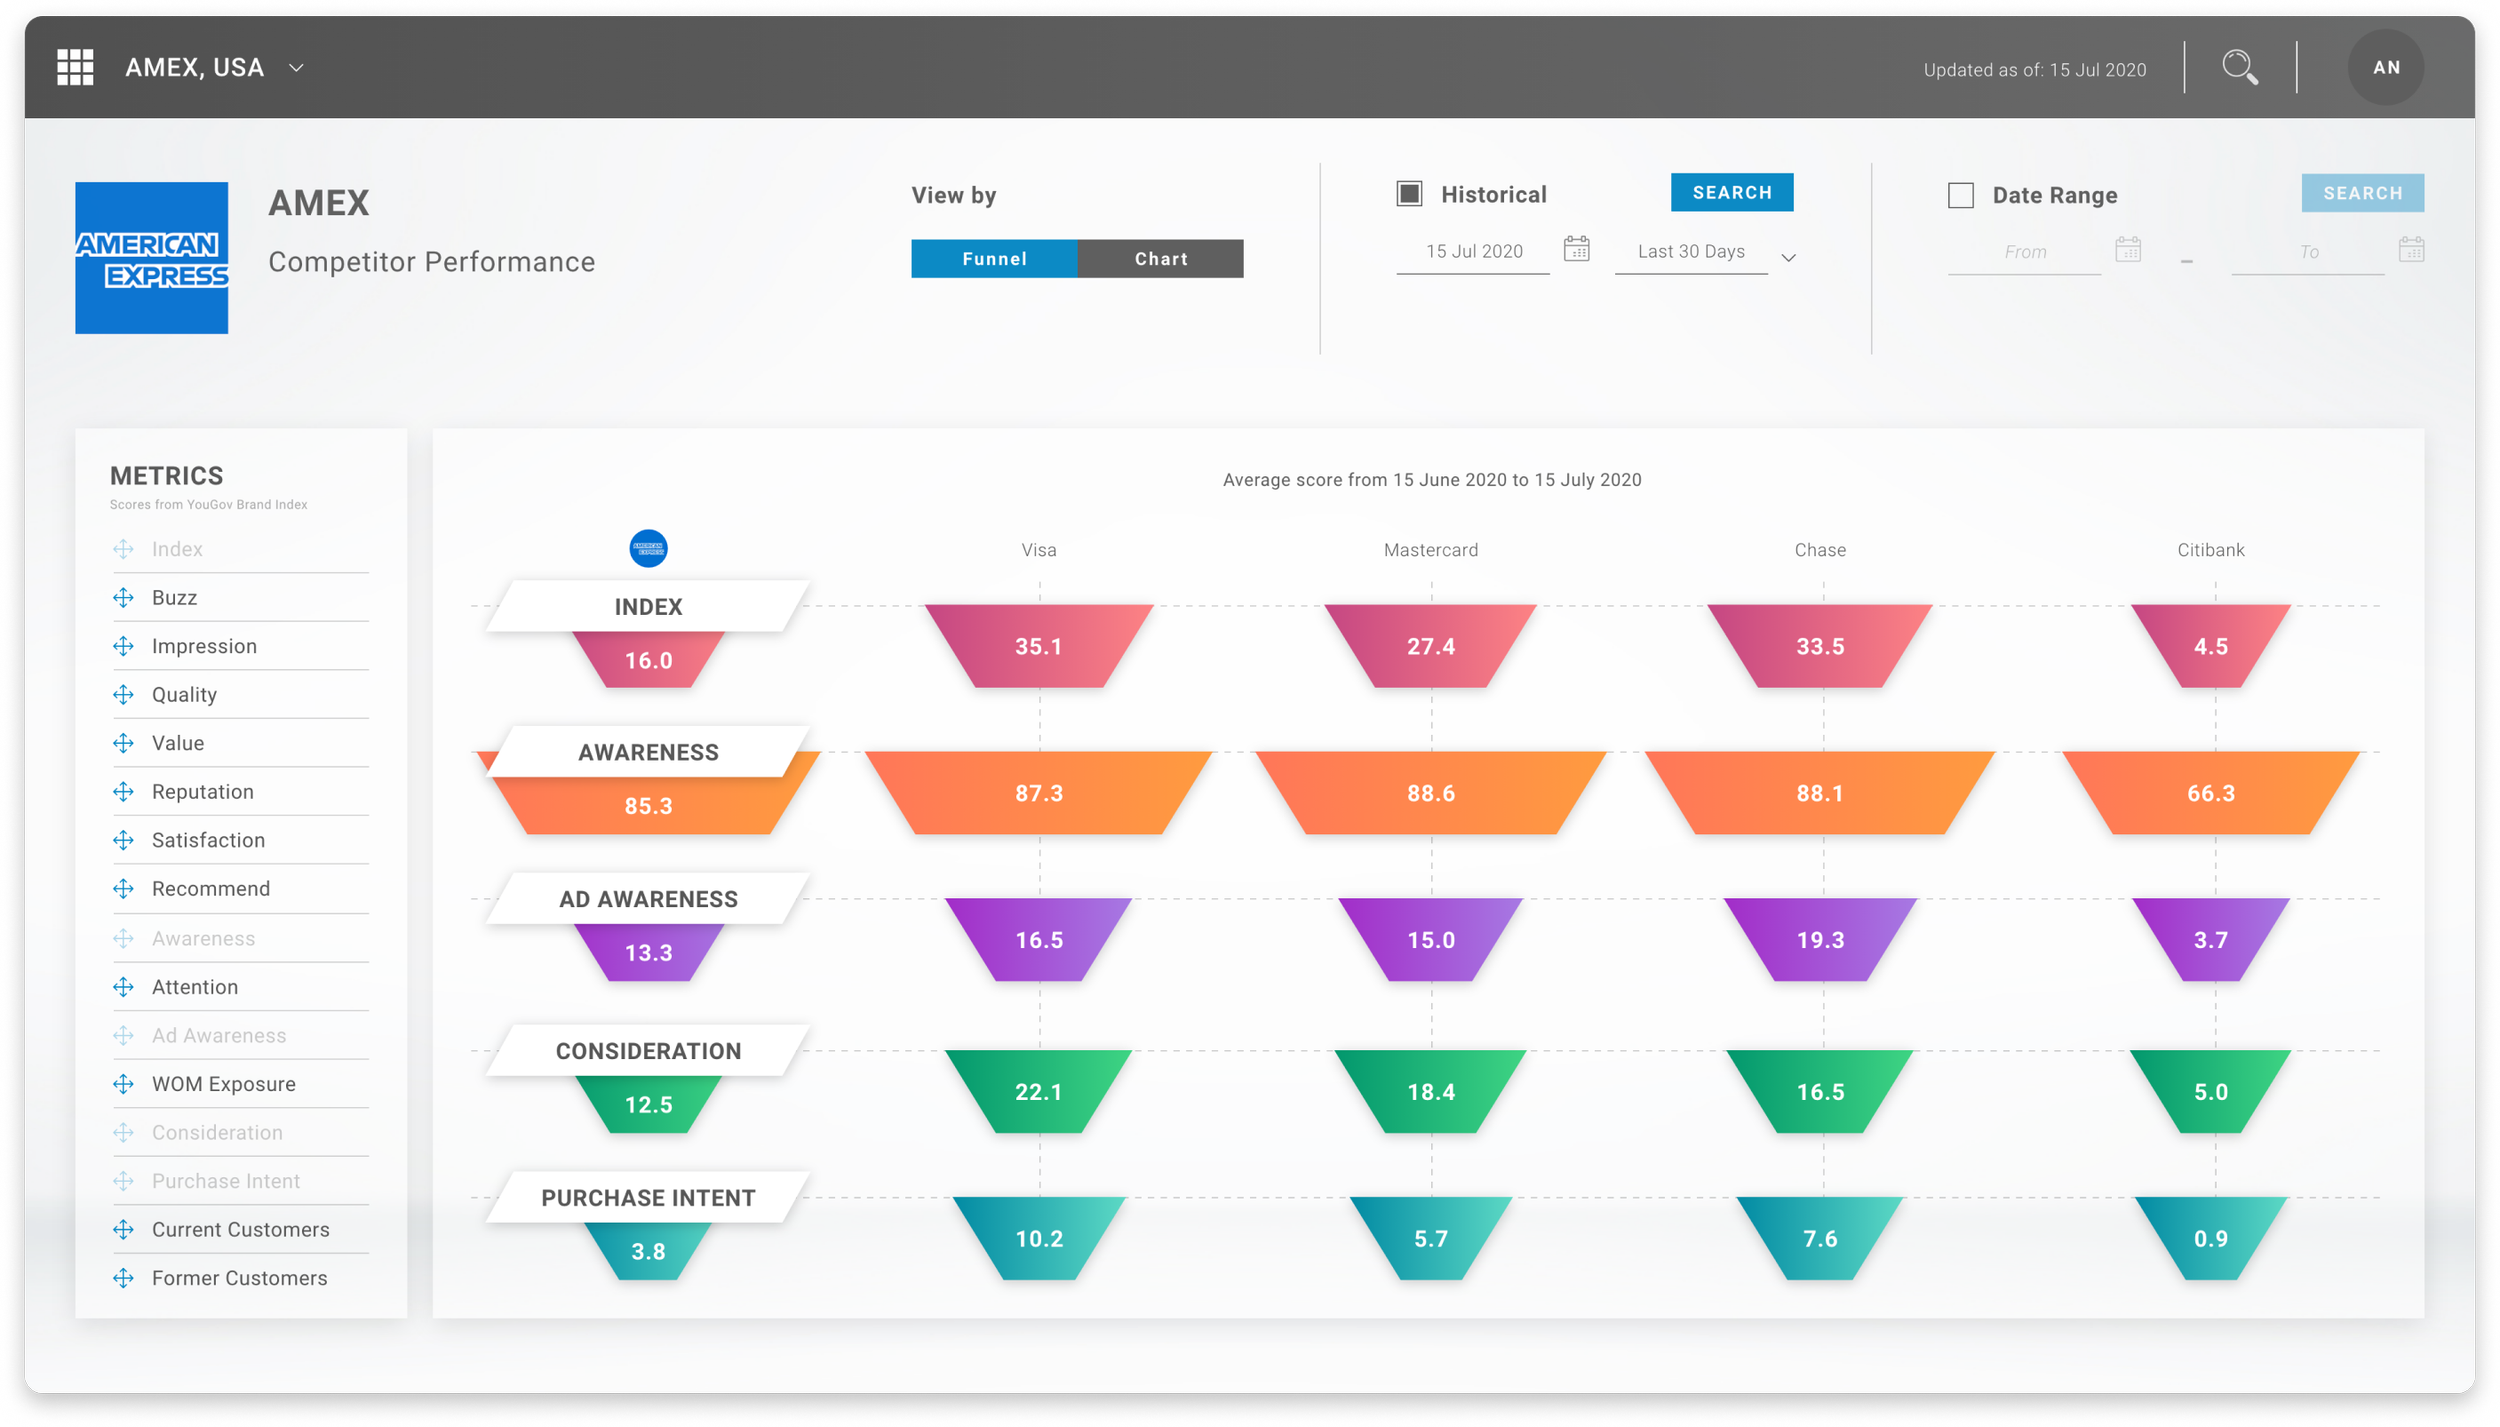
It is not just about 1 brand, but also the competitors that are determined by the marketer. This help visualise the playing field and information helps make informed decisions.
Consumer data
Consumer data
The second part involves consumers perception and reactions to the brand. This helps inform the reasons of those reactions with articles, survey data, and the advertisements that has been used during the period.
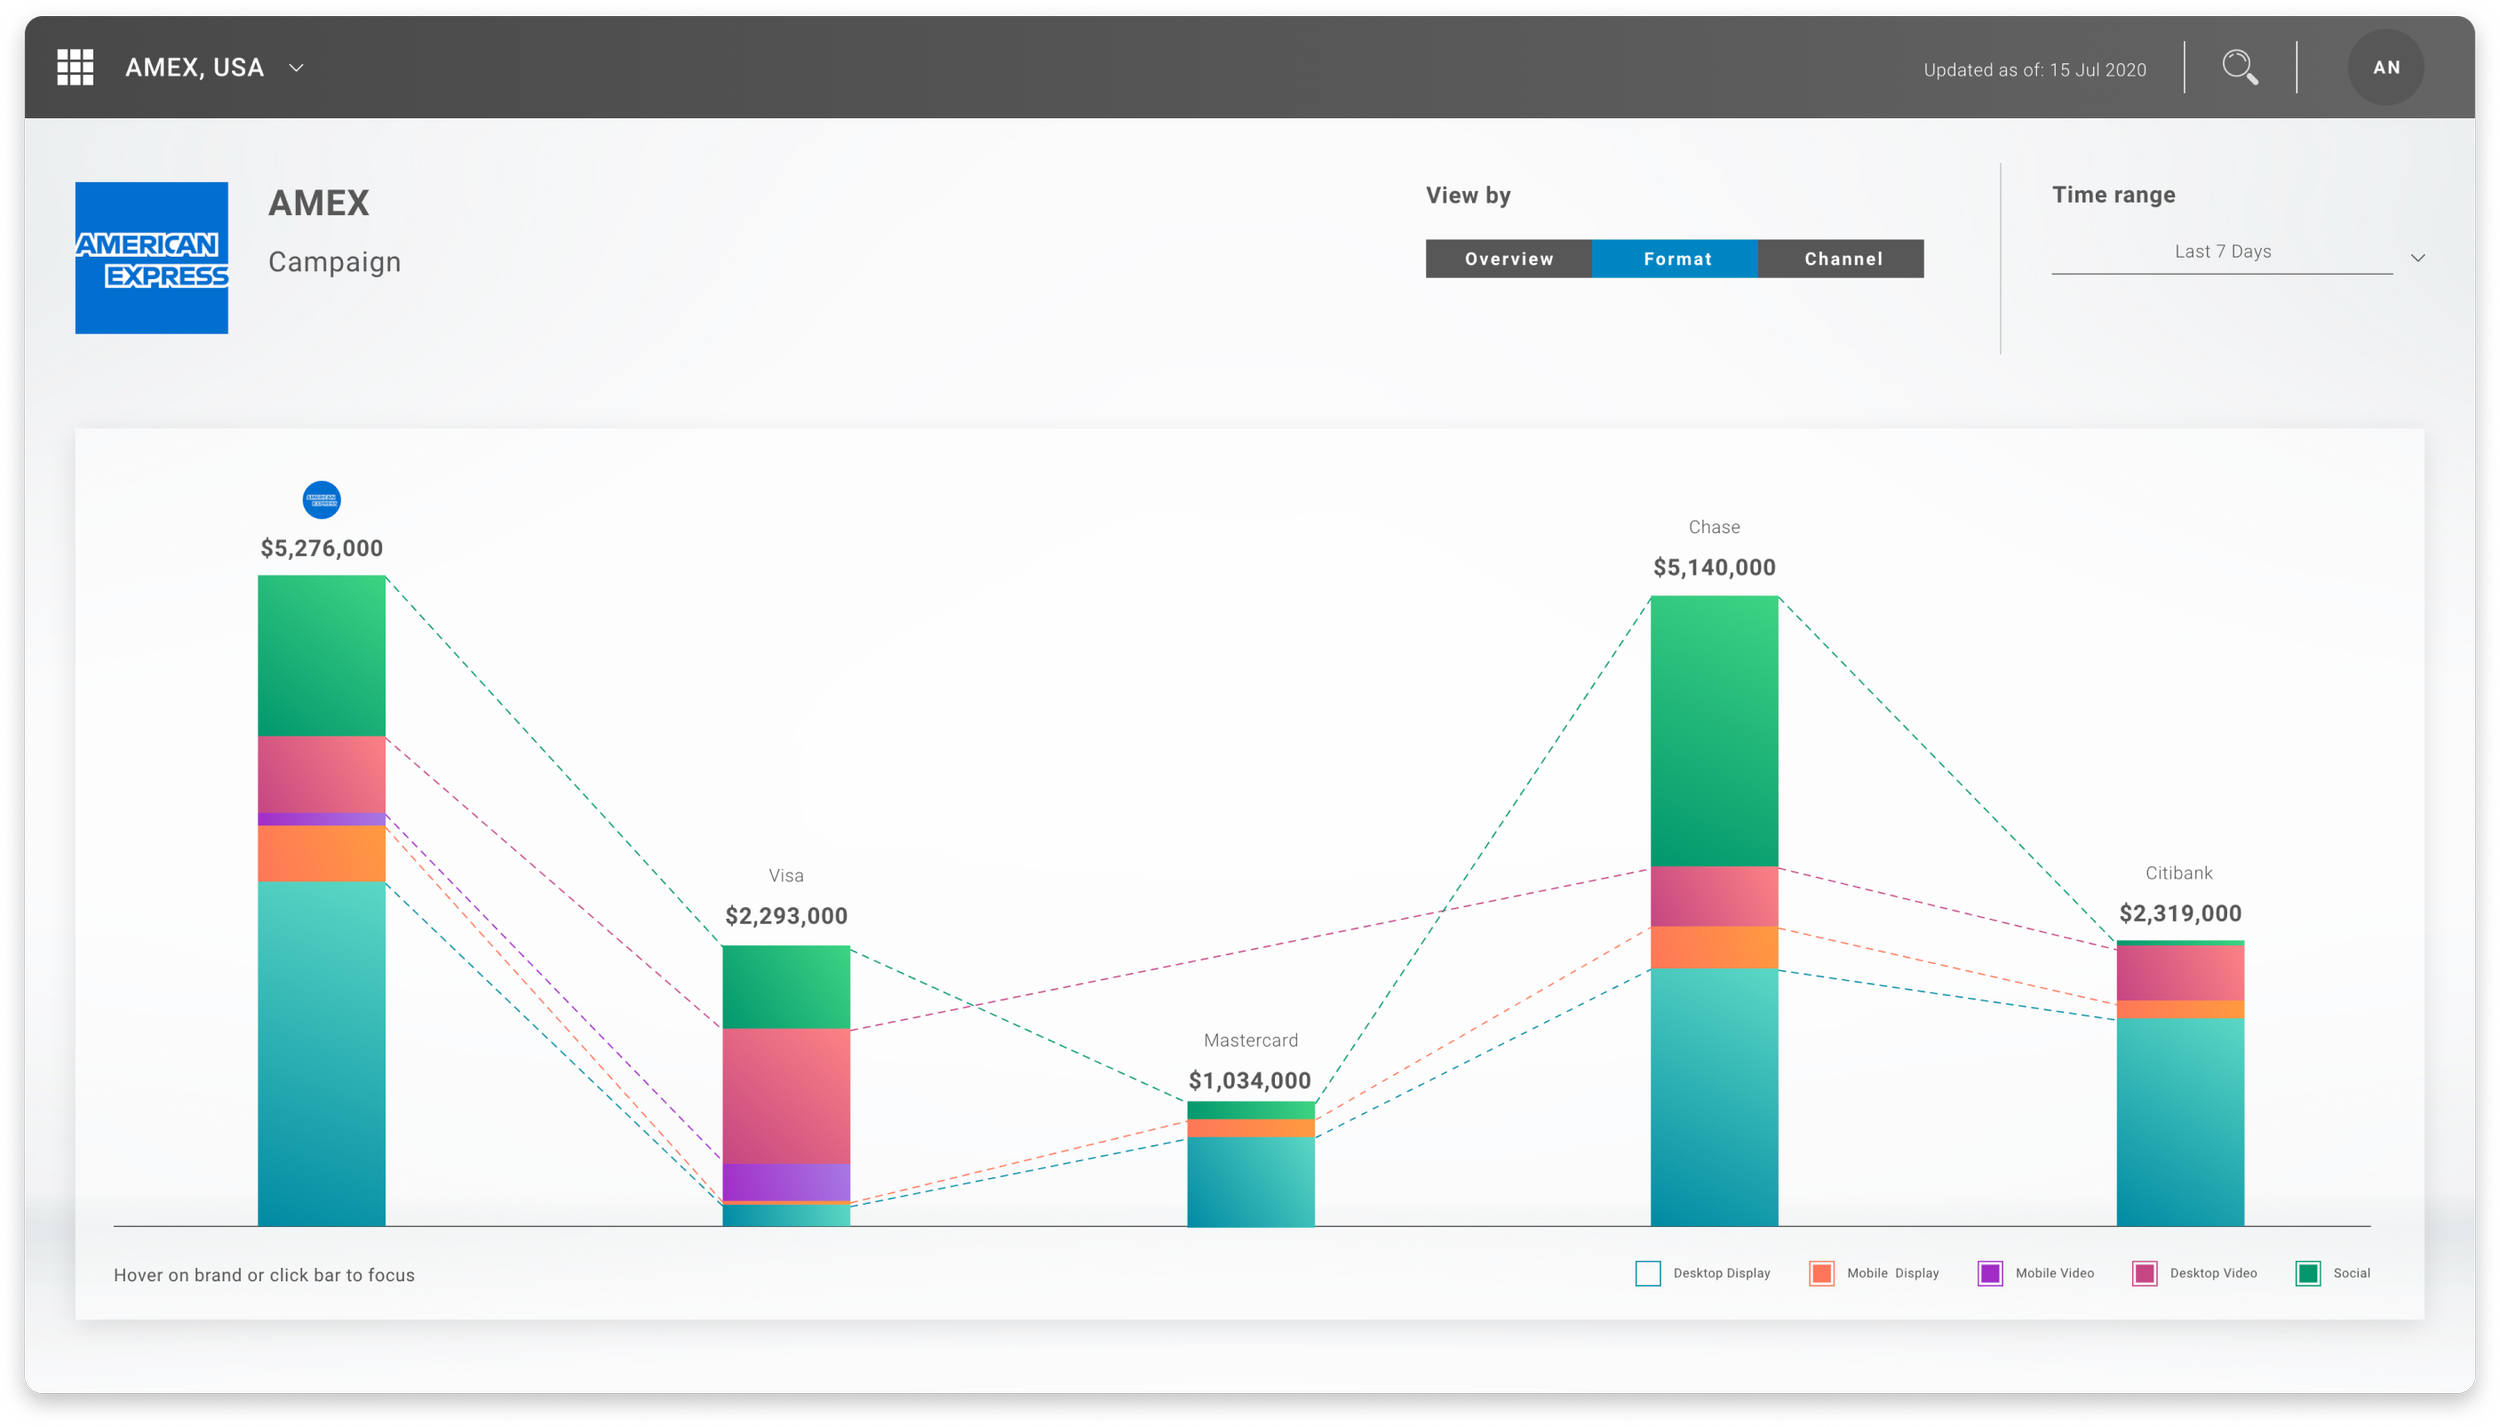
An overall campaign spending view, across the pre-selected competitors.
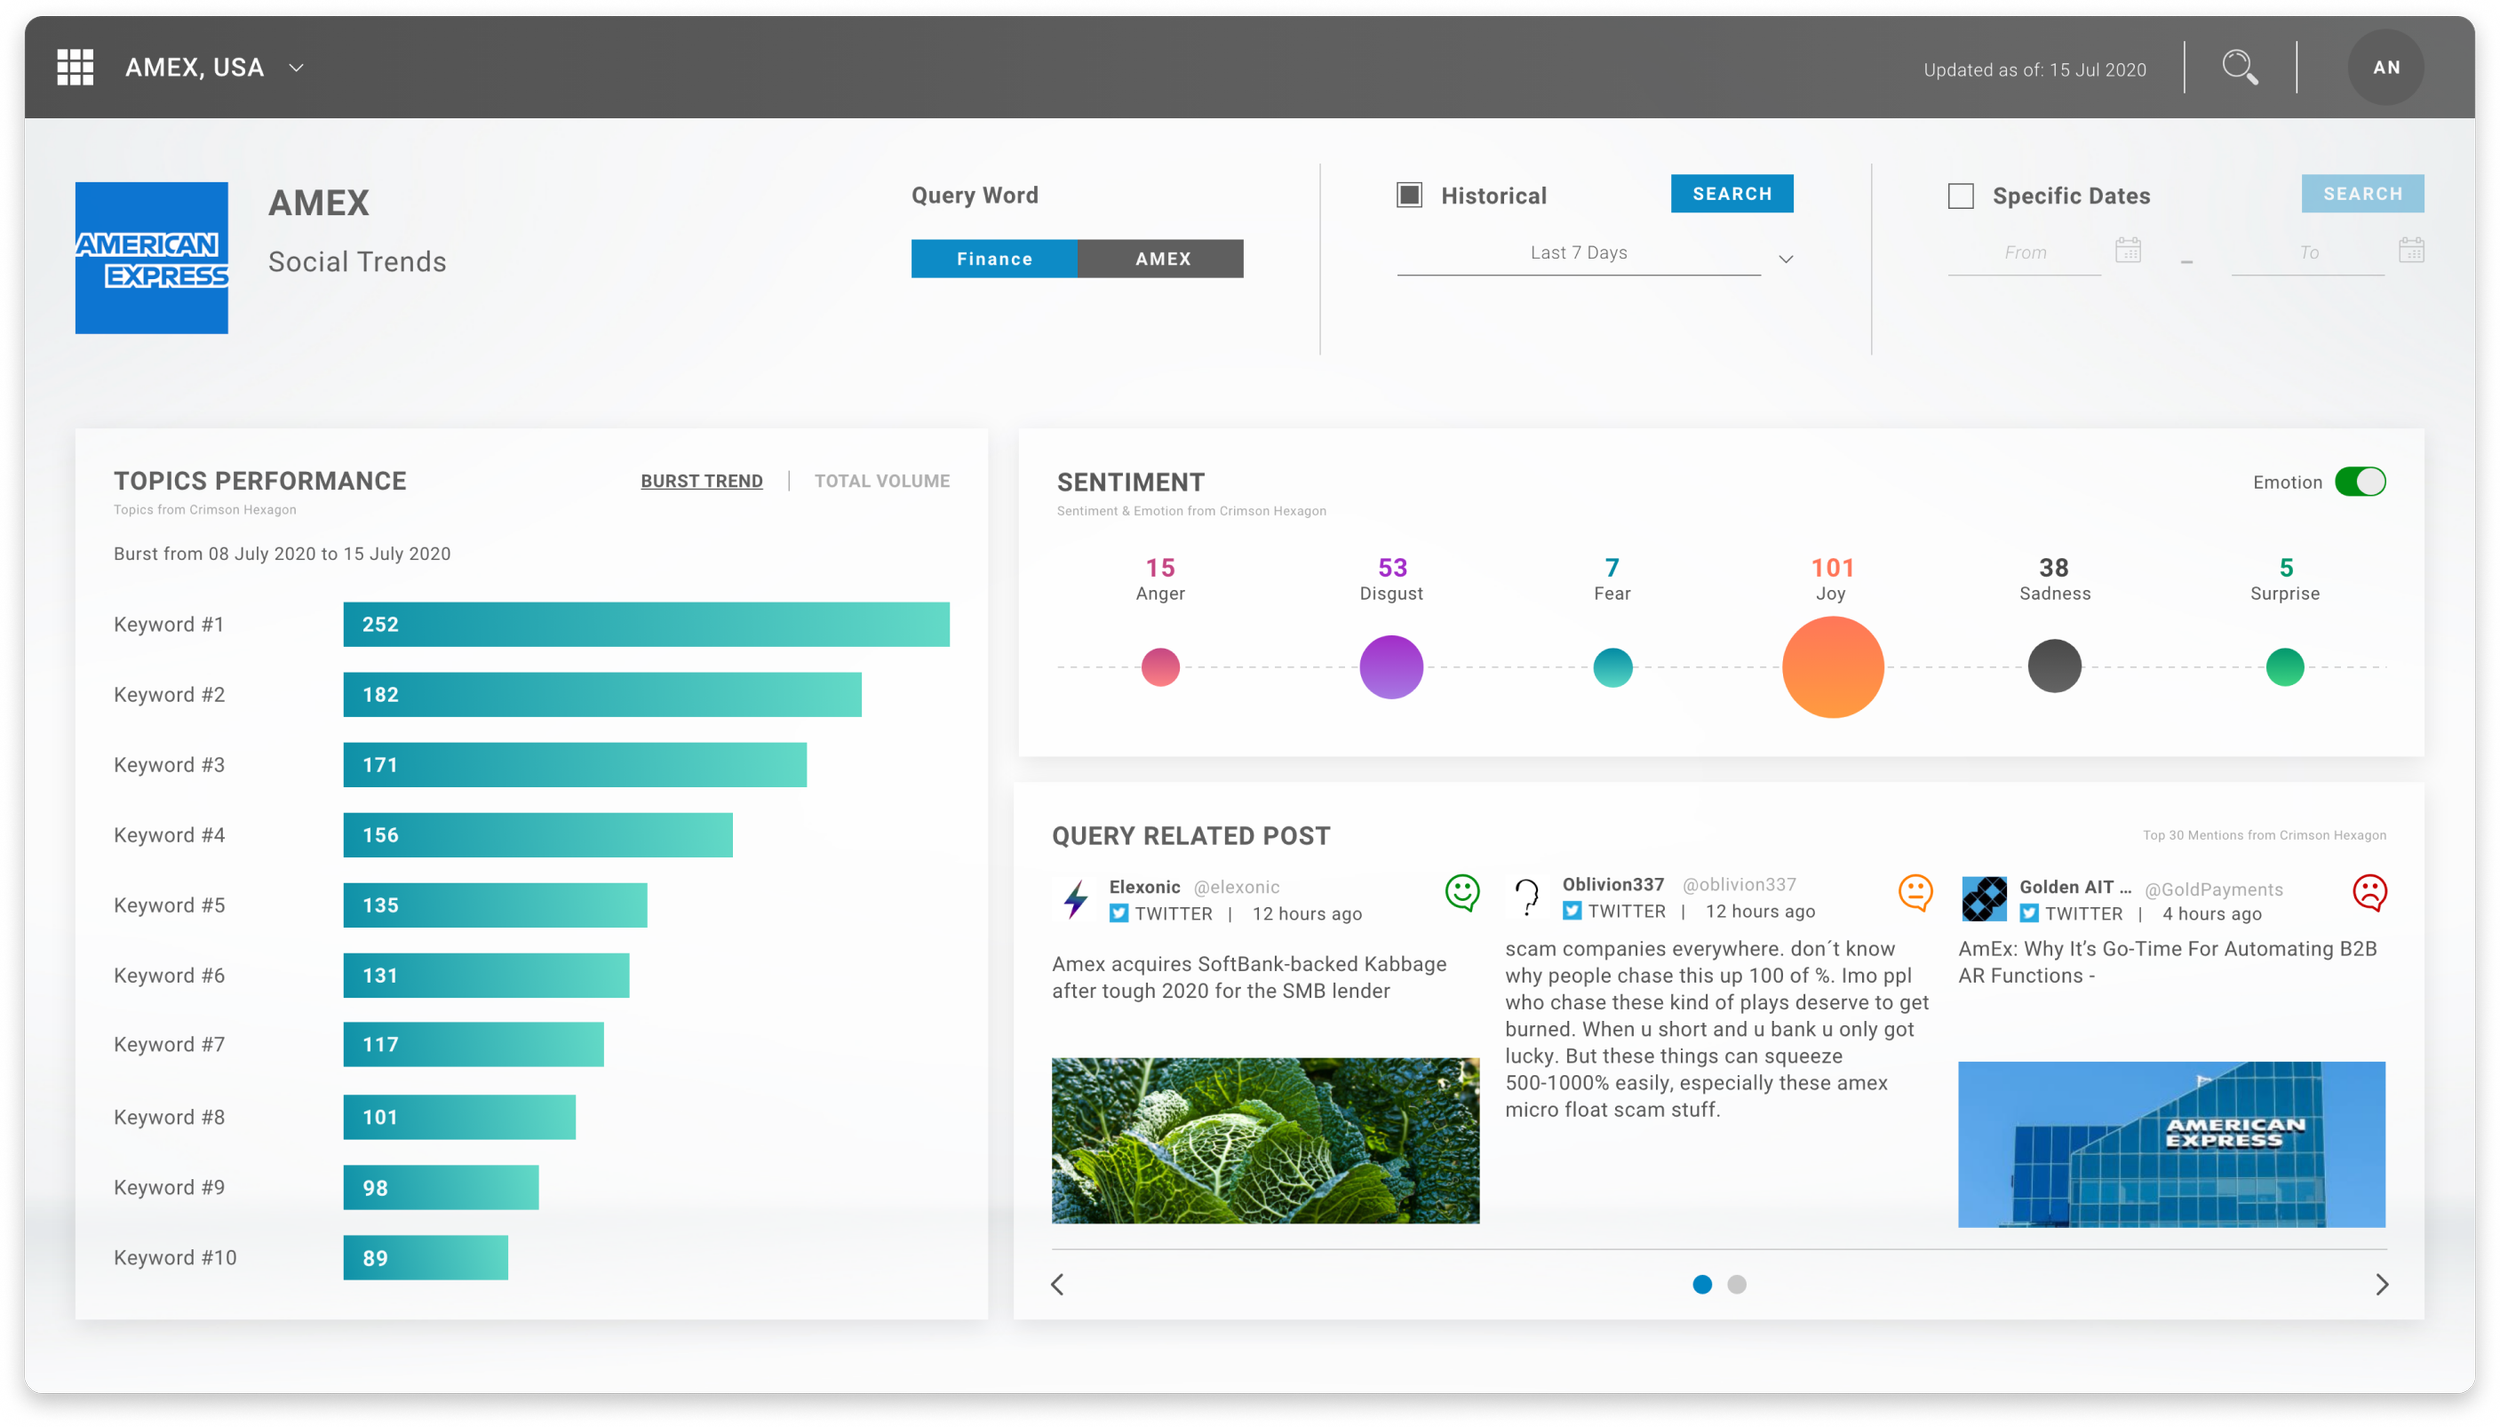
Culture trends and keywords used throughout social media, with an emotional scale.
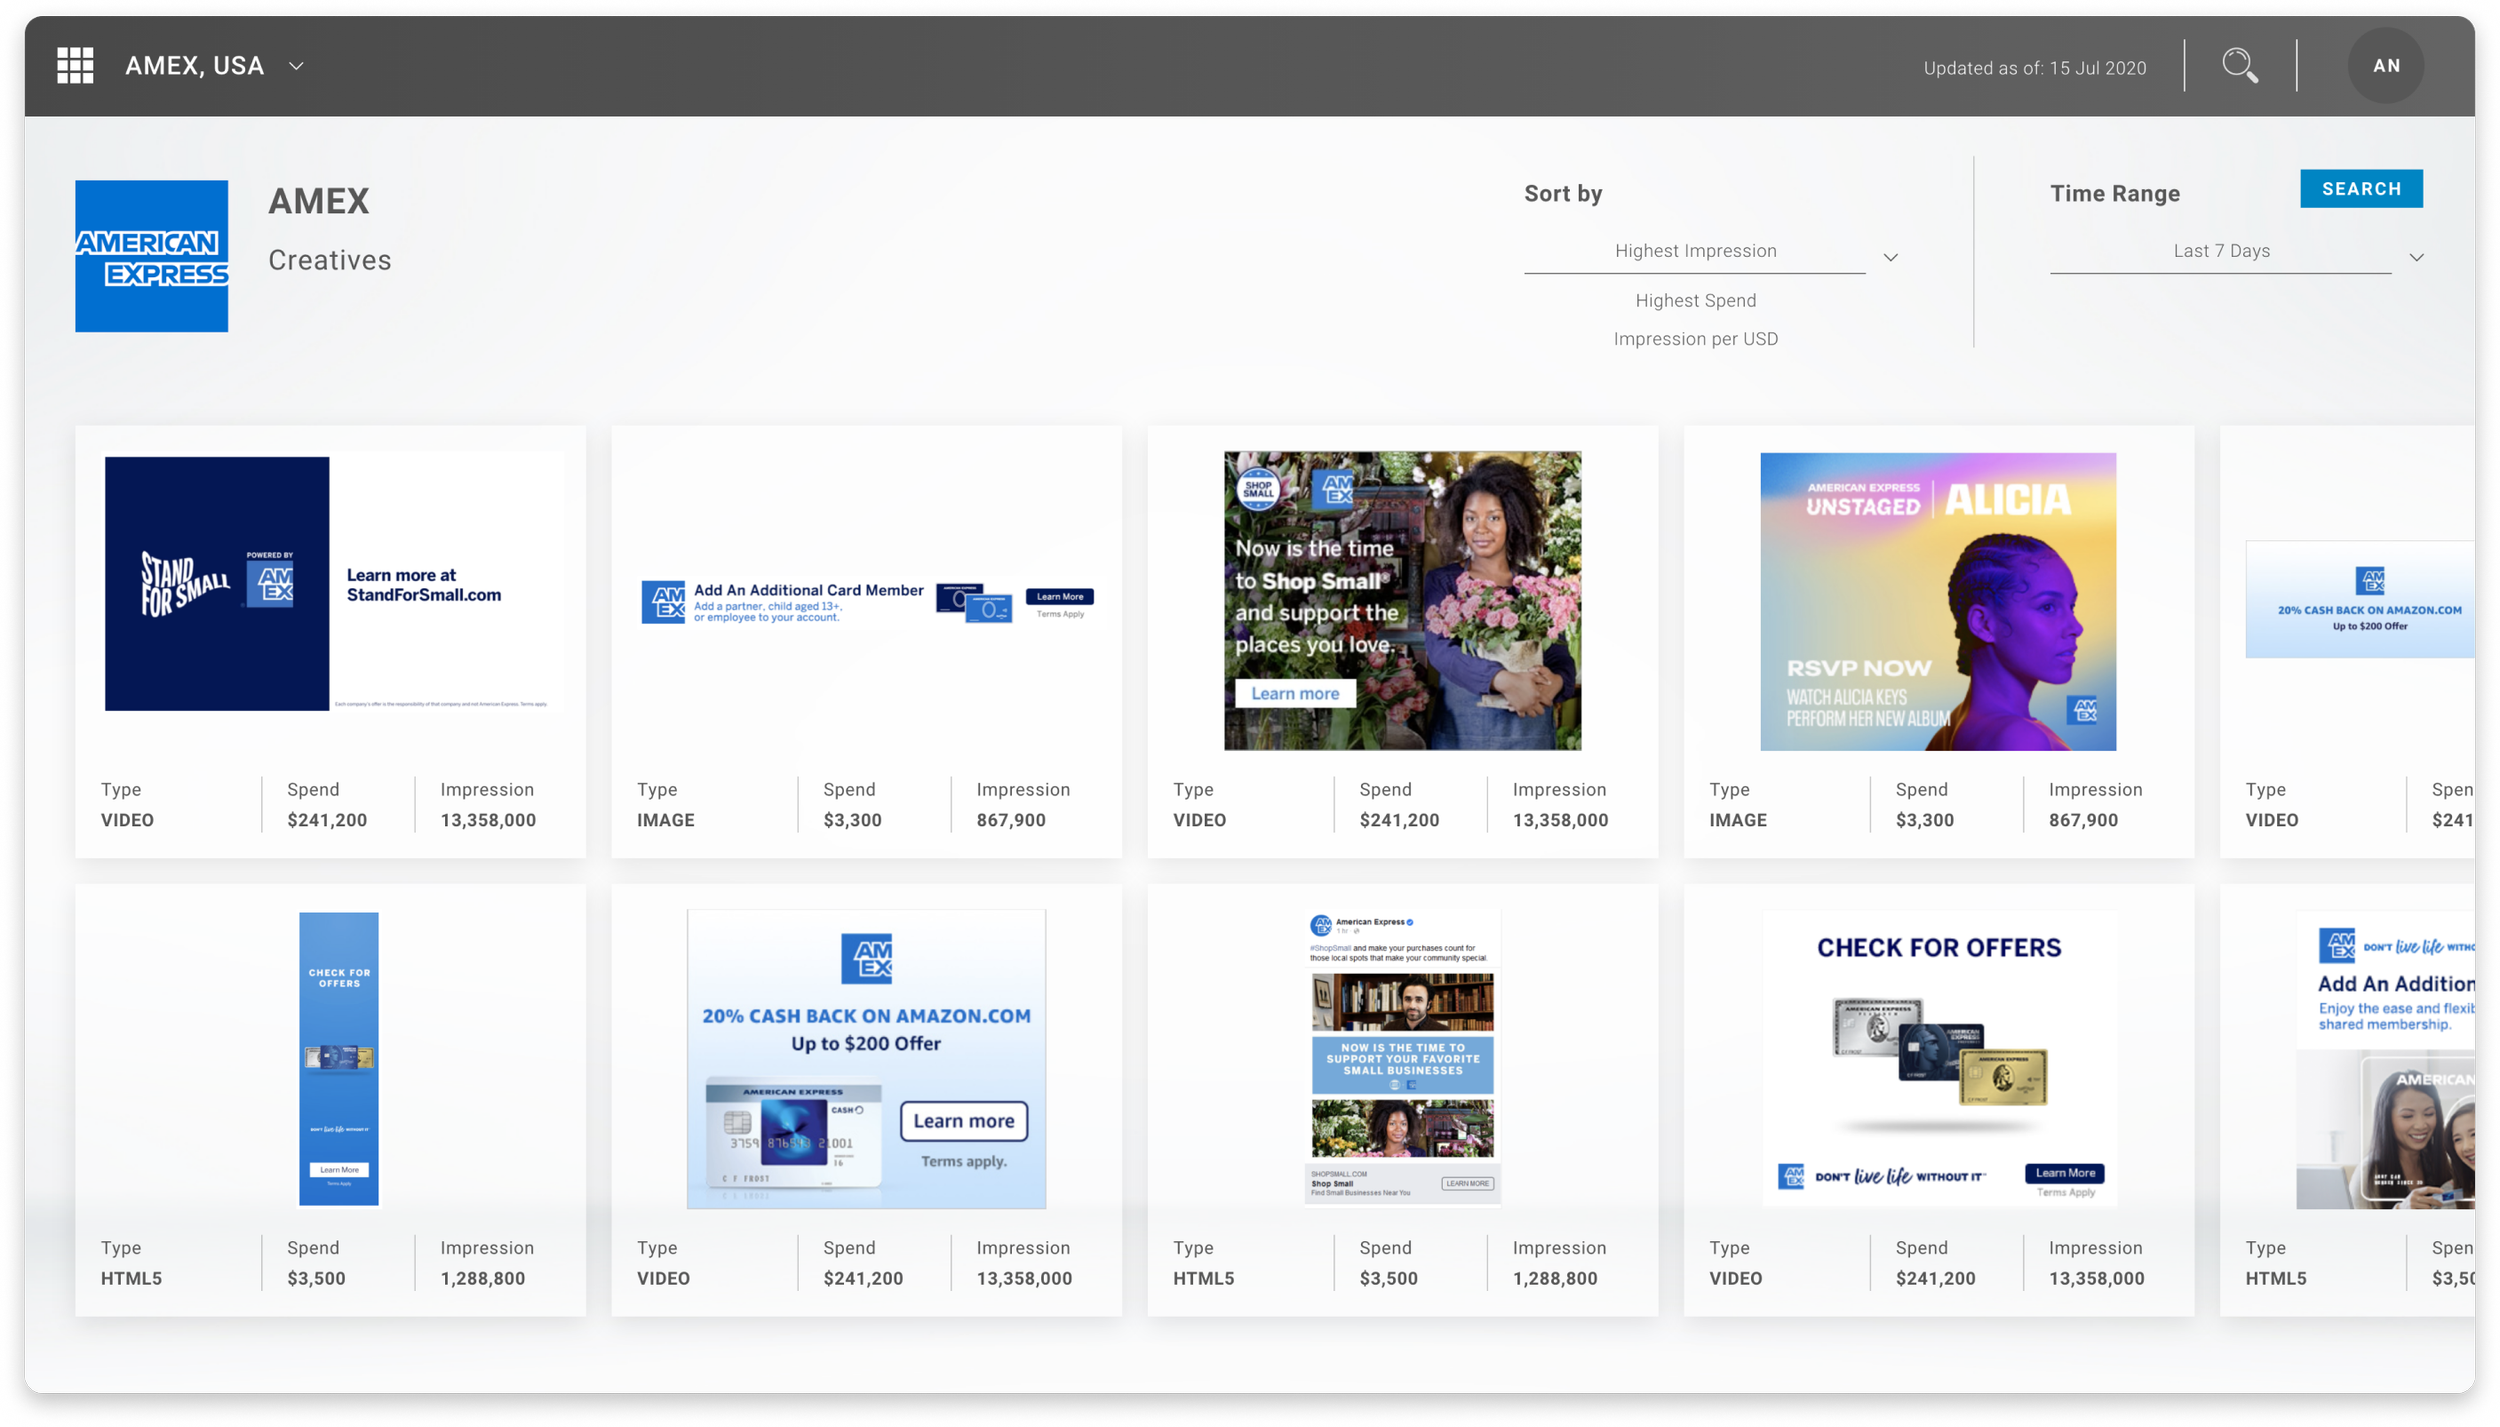
On-going creative advertisements that has been pull to see which are being received well.